Host Genome x Diet Interaction QTL Database 1.0.
The database is the interface to Jbrowse which enables visualization of host genome (Mus Musculus) QTL and its interaction with diet regulating various physiological and patho-physiogical phenotypes.
The interface also provides SNPs and INDELs from four founder strains i.e. BxD2/TyJ, NZM2410/J, CAST/EiJ and MRL/MpJ for fine-mapping QTL to candidate genes.
Nurture, nature and traits
Steps for browsing QTL data for phenotype of your choice in Jbrowse.
The QTL regulating the traits of your interest can be first searched in QTL tables either for Genome-wide QTL or Chromosome-wide/Suggestive QTL.
In Jbrowse three type of model for QTL are available i.e Additive, QTL interacting with Diet (QTL x Diet) and QTL interacting with Sex (QTL x Sex).
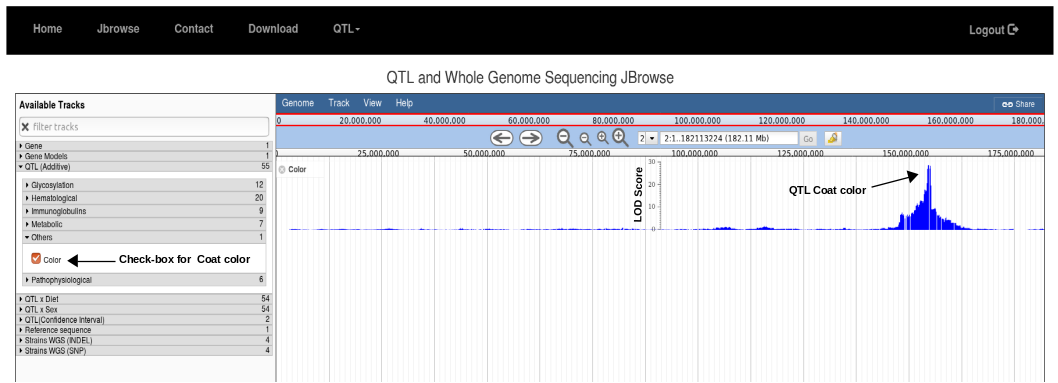
Here we have given the example of Coat color QTL (Additive) in mouse on chromosome 2.
1. Go to Jbrowse and click the check-box for color in QTL(Additive) drop-down tab. Uncheck all the other buttons if open. Then, in search box write 2 and press go. It will show manhattan plot for coat color on chromosome 2 where y-axis shows LOD Scores.

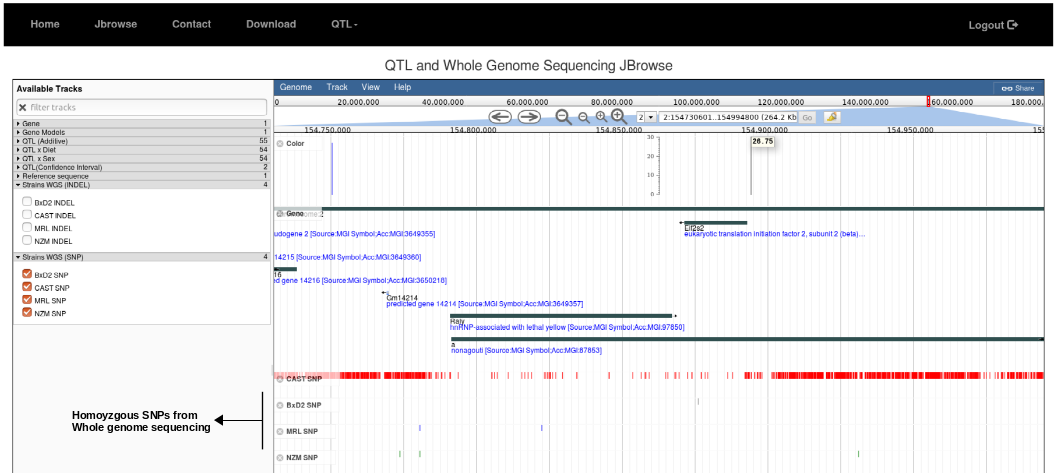
2. Zoom and navigate into the peak region in the QTL. Click on Gene or Gene Model (for splice variants) to locate genes within the region. Hover the mouse click on the bar to see LOD score for SNP of interest.

3. Next zoom into the candidate gene and click on the drop-down tab, Strains WGS (SNP) or (INDEL) to compare the SNPs/Indels (whole genome sequencing, WGS) among the founder strains. The details about the quality of every candidate SNP/INDEL can be explored by clicking color-coded small bars in Jbrowse. These SNPs and INDELs can be used to create CRISPR/Cas9 gene-traits mouse models.

4. The Jbrowse can also be used for searching overlapping QTL between the traits. In this case diet interaction QTL for IgM and sex interacting QTL for HDL.


